Home > On-Demand Archives > Talks >
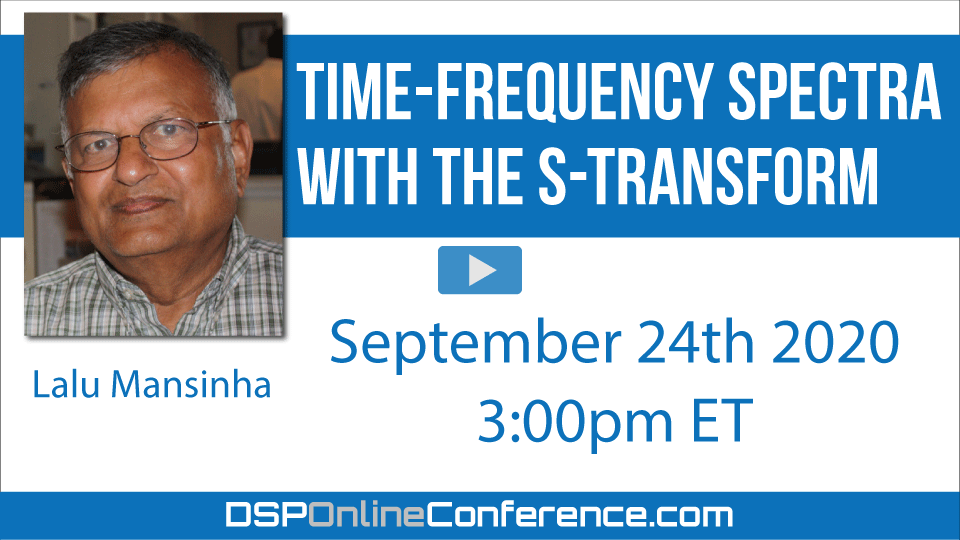
Time-Frequency Spectra with the S-transform
Lalu Mansinha - Watch Now - DSP Online Conference 2020 - Duration: 46:43

Most interesting data series consist of signal and noise series that are usually non-stationary, i.e. the properties fluctuate with time.Fourier analysis (FT) of the whole time series provides the spectrum of the whole time series, but is not capable of showing the time variation of the spectrum.The S-transform, also known as the Stockwell Transform (ST), uses a scalable, translating Gaussian window to determine the local spectrum at every point on the time series.The local spectrum supplements the local temporal information in the time series, and aids in the detection of onsets and cessations of events.For a N point time series, the output of the FT is a N point complex spectrum; the output of ST is a N x N, 2D time-frequency matrix, giving a N point spectrum at every point on the time series.Since the original time series contains only N points, the additional N2 - N points is a measure of the non-independent, redundant information computed for the ST.The redundancy is useful in presenting the similarities in the neighbouring local spectra and contributes to the visual continuity and smoothness to the 2-D time-frequency spectrum. The computation and storage of N2 - N additional points is a major drag on the usage of ST. Several approaches to reducing the computational burden are presented.Local spectra aids in analysis of 1D data. In images, the 2D local spectra aids in definition of texture and image segmentation.For 3 and 4 colour images, Trinion ST and Quaternion ST have been defined.In use since 1997, ST has found applications in numerous disciplines, including medical data series and images; power quality disturbance; atmospheric physics; exploration geophysics etc.The ST has been implemented in ARM and Raspberry Pi processors by several researchers.
This presentation is introductory, for the interested practitioner.Mathematical content will be at the absolute minimum.
Happy that you liked the presentation. Appreciate the compliment.
Boulem Boashash did generalized gabor transforms... any relationship?
Boulem Boashash was the Associate Editor of IEEE Trans Signal Processing who handled our original S-Transform paper in 1993. So I am assuming that the ST at that time (1993-1996) did not overlap with anything he had worked on. Boushash has worked extensively on time-frequency methods. It is possible that he has extended the fixed length Gabor Transform (which uses a Gaussian) by scaling. I did a cursory Google search 'Boulem Boashash Generalised Gabor Transform' but did not find a specific reference. It maybe in his book.
Hi Lalu,
Thanks for your interesting talk. I'm wondering if the S-Transform has applications in signal source separation ? - I'm thinking of audio/music.
Thanks for listening to my presentation. I have not addressed this problem before. Off the cuff, the ST may be able to help in source separation, if the sound from a source arrives at a specific time, and has a specific spectral characteristic. Can be an interesting aspplication.
Hello, thank you for the presentation. The S-transform pictures starting at time 14:20 of the presentation look like a matlab spectrogram plot. As I listen to your presentation, I am thinking that the matlab spectrogram must be a type of time-frequency analysis. Is it similar to the S-transform? Do you know, would the only difference be the windowing function?
I would like to add to my earlier comment. Yes, a spectrogram is the very earliest type of time-frequency analysis, using a STFT (Short Term Fourier Transform). It is fast, but does not resolve the lowest frequencies atr all.
You are right. It is a Matlab spectogram, with a Hann window. Sorry the video stalled. I was just a few slides from showing the S-transform plot.
Wonderful, thank you for the presentation.
Thanks for your comments. Hope you managed to see the entire video.
This video is broken at the end (cut). There are about 15 minutes missing. Will try to fix this asap.
Fixed now. The video should play through the end.
This is similar to proportional bandwidth spectrum analysis. BW is proportional to center frequency... Called constant Q filter banks... Optimal matched filter for detecting and estimating linear FM sweeps is BW proportion to sqrt center frequency. Once built 10 octave spectrum analyzer with 1000 proportional bands per octave. Ear is constant Q filter bank.
You are right Fred. Viewing this problem as a filter banks concept also leads to very similar results. Wavelet Transform can (and is) treated as filter banks.
S Transform of the Brain Fever Bird call was missing at the end
the ppt contains the missing segment...
Stephane, can you open the zoom early?
missed the last few minutes.... darn
seems like the video stopped
Something has happened to the video
I think we missed the last part of the presentation. :(
Is it just me or does it end too soon? For me it stopped at 46:43 kind of in the middle of a sentence. I tried reloading but got the same thing.
The same for me. Seems the video was cut off during upload or something.


Thank you! I especially appreciated the resources and backgrounds of Gabor and Hamilton.